IE Week in London has come and gone. Unsurprisingly, the escalation of tensions between the US and Iran — and the risk of kinetic confrontation — dominated discussions (MEES, 13 February). Geopolitics trumped (no pun intended) oil fundamentals as participants peered into the US foreign policy crystal ball. Yet fundamentals were by no means ignored.
Despite the start of 2026 being marred by temporary supply outages in the Caspian and the US, the forward outlook for supply and demand in analysts’ spreadsheets worldwide points to a sizeable surplus this year. The broad consensus is that implied stock builds will be heaviest in the first half of 2026. According to the International Energy Agency (IEA), total liquids builds will exceed 4mn b/d in the second quarter (see chart 1).
 1: IEA Sees Huge Implied Stockbuilds Persisting Throughout 2026 (mn b/d)
While the IEA’s estimates sit at the more bearish end of the spectrum, other private and institutional forecasters also anticipate an annual bulge in inventories, generally within a 2–3 mn b/d range. I do not want to quibble over whose balance is more accurate; the central narrative is that the global balance points to a meaningful surplus this year.
Yet Brent prices have not collapsed under the weight of this supposed glut — even allowing for support from a geopolitical risk premium related to Iran. Moreover, the forward curve in Dated Brent swaps remains firmly in backwardation, with prompt prices above deferred ones, signalling near-term supply tightness.
Reconciling price action and curve structure with the projected oil balance has led some to question the validity of the latter. In my view, this reflects an overreliance on the headline balance figure, when the devil lies in the details — namely, the components of the global balance.
Focusing solely on the headline global oil balance often leads to flawed conclusions about price direction, with trading strategies subsequently going awry. To begin with, the balance measures a change and must be applied to a starting point. Global observed inventories ended 2024 at levels broadly similar to those seen in 2022 and 2023 and recovered to above-average territory by the end of 2025 (see chart 2).
2: IEA Data Shows That Global Observed Inventories Surged In 2h 2025 (mn barrels)
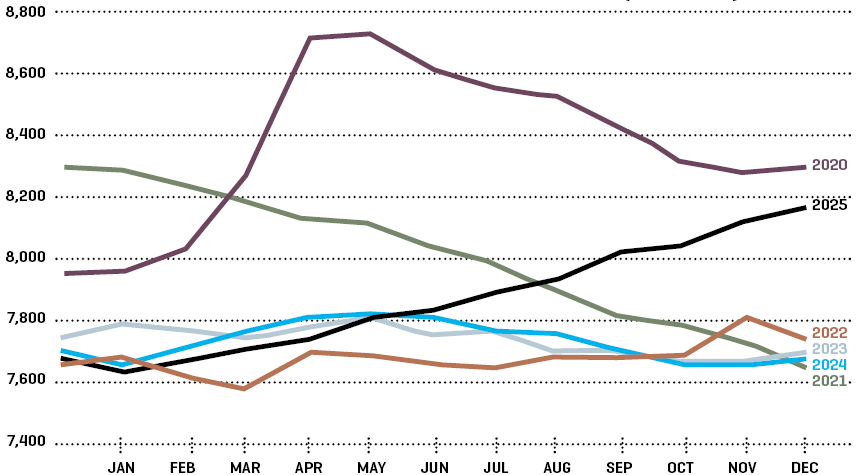
According to the IEA, these stocks rose by 477mn barrels, or 1.3mn b/d, last year, with further substantial builds projected for 2026. This appears unequivocally bearish — until the stock change is decomposed by geography, and by oil and storage type.
The global forward balance does not provide a geographic split between OECD and non-OECD regions. That breakdown only becomes visible once OECD data are released. When combined with estimates of floating storage and oil in transit, the non-OECD portion of the global change can be inferred. In 2025, OECD industry-held oil stocks spent most of the year below their five-year average and, in early 2026, do not appear to be anywhere near surging. The implied global stock builds are therefore occurring elsewhere. With inventories remaining low in the OECD’s main pricing hubs, it is not surprising that Brent has not plunged towards $50/B, or lower, as some bearish Wall Street banks have predicted.
The forward global balance also does not distinguish between crude and refined products, as it aggregates total liquids. Satellite tracking — from providers such as Kayrros — allows crude stock changes to be assessed and the balance to be disaggregated historically.
Looking ahead requires building a forward crude balance, comparing global refinery demand with crude supply. Subtracting the crude balance from the implied total stock change yields the products balance, assuming perfect data. According to the IEA, crude accounted for 86% of global inventory build in 2025, or 412mn barrels. The agency notes that “the increase was mainly driven by a 111mn barrel rise in Chinese stocks, mostly crude oil, and surging oil on water, in particular floating storage.”
Most observers assume that implied stock builds in balance estimates end up in commercial storage, influencing prices and curve structure. While reasonable, this assumption does not always hold — as China demonstrated last year and appears to be doing again in 2026.
A significant portion of China’s crude imports has flowed into strategic reserves, as well as into new refining capacity and pipeline fill, effectively removing barrels from the market. Excluding China, global onshore crude inventories in early 2026 are tracking close to their five-year average, according to Kayrros data — hardly an overwhelmingly bearish signal.
By analogy, this strategic storage dynamic resembles central bank interventions accompanied by countervailing measures to prevent an expansion in money supply. While global oil production may exceed demand on paper, effective supply available to the market is reduced by strategic stockpiling.
With ample spare storage capacity still available, China’s continued strategic buying could keep a sizeable volume of barrels off the market this year. The tightening effect is reminiscent — albeit on a larger scale — of the US’ own SPR filling under the George W. Bush administration, which at times offset bearish sentiment when Saudi production was perceived to be elevated.
Chinese buyers are widely seen as price-opportunistic, increasing purchases when crude is deemed cheap — often interpreted as Brent at or below $70/B. This tendency is reinforced when supply security becomes a concern. Given current geopolitical tensions in the Middle East, the ‘convenience yield’ of holding inventories — the non-financial benefit of holding physical oil amid disruption risk — is likely elevated. This should, in my opinion, help sustain Chinese demand even as Brent trades closer to $70/B.
Beyond onshore storage, oil can also accumulate in vessels, or so-called floating storage (see chart 3), distinct from oil in transit, which is a flow with a defined discharge destination. In periods of excess supply, market clearing typically requires lower spot prices, a higher forward curve to cover storage and financing costs, or a combination of both. During episodes such as the 2008 financial crisis or the 2020 pandemic, pricing moved into ‘super-contango’, enabling cash-and-carry trades both onshore and at sea.
3: IEA Sees Huge Build Up Of Sanctioned Oil On Water In Late 2025 (mn barrels)
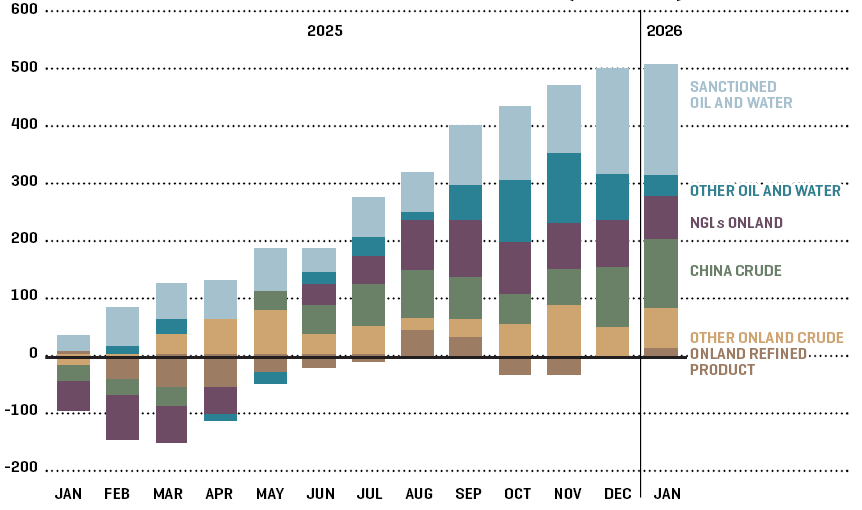
Today’s Brent curve, by contrast, is in backwardation through December 2026, signalling scarcity. The IEA estimates that oil at sea rose by 248mn barrels in 2025, with sanctioned oil accounting for 179 million of that total. These barrels are not part of traditional cash-and-carry trades but are effectively stranded oil within a shadow fleet, if their traditional buyers in India and China are absent.
If India reduces its intake of Russian crude to placate Washington, it will need to secure alternative supplies elsewhere, including from the Middle East and the Americas. Greater competition for Atlantic Basin barrels would, in that case, support Brent prices.
Moreover, if India avoids Russian barrels and China does not absorb the surplus, the lack of outlets for its sanctioned oil could ultimately force production shut-ins in Russia.
Forecasts of the forward oil balance are, of course, subject to uncertainty and statistical noise, including unaccounted-for oil — the so-called ‘missing barrels’ — in baseline figures. The picture may look different in a few quarters as data revisions inevitably filter through. Supply prospects for Iran and Russia also remain uncertain.
Still, one lesson is clear: the headline global balance alone is insufficient to justify a bearish price outlook when sizeable storage components are not freely available to the market. When Opec+ meets on 1 March to reassess its supply policy, there may be little need to pre-emptively cut output to avert a price collapse, as some suggested during IE Week. At the same time, any hint that additional supply will be brought to market could weigh on prices, as illustrated by the recent impact of Bloomberg headlines citing Opec sources on a potential April output increase. The influence of Opec’s marginal barrel is greatest, in my view, when OECD inventories are restrained and the market remains in backwardation.
It may therefore be wiser to wait and assess how the components of the balance evolve before reinstating further barrels from voluntary cuts. As Napoleon Bonaparte is often credited with saying, the best course of action is often inaction.
*Harry Tchilinguirian is former head of research at Onyx Capital Group, Head of Oil Research at Totsa, Head of Commodity Research at BNP Paribas and Senior Oil Analyst at the IEA.