Saudi Arabia faces a sharp fall in its crude exports. Its role as OPEC’s swing producer means it will have to cut output in order to balance the market amid growing Iraqi, Libyan and Iranian production. Meanwhile, soaring domestic demand means volumes available for export will fall yet further. On present trends Saudi crude exports will fall to only 1.8mn b/d by 2018, a quarter of current levels.
By- Behrooz Baik Alizadeh*
It is often repeated that Saudi Arabia has a unique role in global oil markets. This role is effective because Saudi Arabia is OPEC’s biggest crude oil exporter and acts to balance the oil market. Simultaneously the role is exclusive since Saudi Arabia controls the single biggest source of spare production capacity in a market driven by deep geopolitical concerns.
CALL ON OPEC TO FALL
One may ask how long can Saudi Arabia maintain this position. To answer the question we have to look at the call on OPEC in the medium term. It can be seen in Table 1 that up to 2018 the call on OPEC crude will follow a downwards trend and will fall from 29.7mn b/d in 2014 to 28.9mn b/d in 2018.
To compare the call on OPEC with OPEC production, we need to check recent OPEC crude oil production figures. Based on secondary sources, OPEC produced 29.701mn b/d in June 2014, below its agreed ceiling of 30mn b/d (see Table 2). Saudi Arabia produced 9.729mn b/d, while other members rank far below. It should be noted that some members, such as Iran, Iraq and Libya, have recently been producing well below their historical production levels due to political constraints, insufficient infrastructure or civil unrest.
IRAQI OUTPUT PLANS
Among these countries, Iraq has touted crude oil production capacity expansion plans: Iraq plans to produce 3.756mn b/d crude oil in 2014 and intends to increase this to 8.274mn b/d in 2018. In 2016 the crude oil production capacity of Iraq will surpass 5mn b/d (see Table 3). But it seems that it is not feasible for Iraq to export more than 4.5mn b/d from its southern ports due to geographical constraints. Therefore, it is more reasonable to assume that Iraq will export 5mn b/d in 2018 from southern and northern outlets combined. If we assume that Iraqi demand will increase by 7% annually (in line with the average 2008-13 growth rate of Iraq’s oil demand), demand will amount to about 1mn b/d in 2016. That means Iraq’s crude production will have to reach about 6mn b/d in 2016 to enable 5mn b/d exports, and for the two years after that, Iraq will have to produce about 6.089mn b/d and 6.164mn b/d respectively in order to maintain exports at the 5mn b/d level.
 Table 1: World Oil Demand And Supply Outlook In OPEC Reference Case (Mn B/D)
| TABLE 1: WORLD OIL DEMAND AND SUPPLY OUTLOOK IN OPEC REFERENCE CASE (MN B/D) | ||||||
| 2013 | 2014 | 2015 | 2016 | 2017 | 2018 | |
| World Oil Demand | 90 | 91.1 | 92.3 | 93.2 | 94.1 | 95 |
| Non-OPEC Supply | 54.2 | 55.6 | 56.8 | 58.2 | 59.2 | 59.8 |
| OPEC NGLs (Inc GTLs) | 5.7 | 5.8 | 5.9 | 6.1 | 6.2 | 6.3 |
| Call on OPEC Crude | 30.1 | 29.7 | 29.6 | 28.9 | 28.7 | 28.9 |
| SOURCE: OPEC, JUNE 2014. | ||||||
Table 2: OPEC Crude Oil Production, June 2014 (‘000 B/D)*
| TABLE 2: OPEC CRUDE OIL PRODUCTION, JUNE 2014 (‘000 B/D)* | |||
| Algeria | 1,145 | Libya | 220 |
| Angola | 1,655 | Nigeria | 1,911 |
| Ecuador | 542 | Qatar | 726 |
| Iran, I R | 2,731 | Saudi Arabia | 9,729 |
| Iraq | 3,161 | UAE | 2,780 |
| Kuwait | 2,758 | Venezuela | 2,343 |
| Total OPEC | 29,701 | ||
| *BASED ON SECONDARY SOURCES. SOURCE: OPEC MONTHLY OIL MARKET REPORT, JULY 2014. | |||
Table 3: Iraq-Forecast Crude Output Capacity, Consumption,Exports And Production (Mn B/D)
| TABLE 3: IRAQ-FORECAST CRUDE OUTPUT CAPACITY, CONSUMPTION, EXPORTS AND PRODUCTION (MN B/D) | ||||||
| 2013 | 2014 | 2015 | 2016 | 2017 | 2018 | |
| Planned Crude Output Capacity* | 2.979 | 3.756 | 4.885 | 6.117 | 7.076 | 8.274 |
| Crude Oil Production^ | 2.979 | 3.756 | 4.885 | 6.019 | 6.089 | 6.164 |
| Domestic Demand^ | 0.835 | 0.892 | 0.954 | 1.019 | 1.089 | 1.164 |
| Available for Export** | 2.144 | 2.864 | 3.931 | 5 | 5 | 5 |
| SOURCES: *IRAQ MINISTRY OF OIL, OPEC WORKSHOP ON CAPACITY AND INVESTMENT, OPEC SECRETARIAT, 4 JUNE 2014. ^OPEC 2014 ANNUAL STATISTICAL BULLETIN (ASB) AND AUTHOR’S CALCULATION. **PRESUMES NO IMPORTS/EXPORTS OF OIL PRODUCTS. | ||||||
LIBYA REBOUND
In addition to Iraq’s announced expansion plans, historical data indicates that Libyan crude production had reached about 1.5mn b/d in 2010 before civil unrest and the uprising in this country. Following recent developments in Libya, rebels and the government agreed to reopen the Es Sider and Ras Lanuf ports. This signals that crude production sooner or later may return back to the recent record level of 1.5mn b/d.
IRAN TO ADD 1MN B/D
In addition to potential Iraqi and Libyan additions to the supply pool, the oil market is following the developments of nuclear negotiations between Iran and the western powers which are in progress. The success of these negotiations could lead to a production increase of at least about 1mn b/d since Iran was producing 3.74 mn b/d in 2012 (OPEC ASB, 2014).
4MN B/D OF EXTRA CRUDE: SAUDI MUST MAKE WAY
Therefore, there is a high probability that in 2015 some 4mn b/d of new crude oil will be injected into a market that calls on OPEC to produce only 29.6mn b/d. In these circumstances, Saudi Arabia has no choice but to adjust its production to make room for those members whose output has been limited during recent years. Otherwise oil prices will be under high pressure of excess supply. Of course, nobody wants a new price war to begin. All producers’ economies are in deep need of their oil revenues and all consumers are aware of the fact that oil price collapse will harm the security of supply, because expensive sources of energy such as tight oil and shale gas need higher prices to survive: low oil prices will disturb the outlook for capacity building.
Against this background, it is time to discuss Saudi crude oil production in more detail. Secondary sources show that Saudi Arabia’s production amounted to 9.729mn b/d in June 2014. This figure will be under pressure from two sides. On the one hand Saudi has to play the role of a swing producer to show that it has still a determining role in balancing the oil market, so its production is supposed to take the burden of a reduction that could potentially total 4mn b/d. On the other hand, domestic demand for crude within Saudi Arabia is increasing sharply. We assume Saudi oil demand will increase by 6% annually, ie in line with the average 2008-13 growth rate. Therefore, Saudi oil demand will increase about 1mn b/d over 2013 to 2018, reaching 3.983mn b/d by 2018 (see graph).
SAUDI CRUDE EXPORTS TO COLLAPSE TO 1.8MN B/D BY 2018
So, in 2018 Saudi production will fall to 5.729mn b/d (9.729mn b/d minus 4mn b/d). Simultaneously this country will have to meet local demand which by then will be 3.983mn b/d. The simple outcome for Saudi Arabia will be the bitter fact that the available oil for export by 2018 will have fallen to around 1.8mn b/d (5.729mn b/d minus 3.983mn b/d equals 1.746mn b/d). This compares to 7.571mn b/d of Saudi crude exports and 312,000 b/d of net products export in 2013.
Whether Saudi Arabia likes it or not, its role is going to fade in the medium term. Saudi decision-makers have only one option open. That is to wait for the longer term and hope higher global economic growth will boost crude demand, leaving it a bigger slice of the pie (see Table 4).
*Mr Alizadeh is Senior Oil Market Analyst at Iran’s Ministry of Petroleum. The views expressed in this analysis are solely the author’s and do not represent the official view of the Ministry. [email protected].
SAUDI DOMESTIC OIL DEMAND (MN B/D)
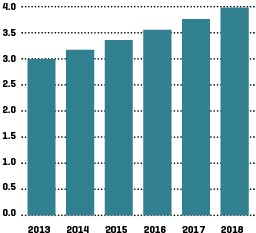
SOURCE: OPEC 2014 ANNUAL STATISTICAL BULLETIN AND AUTHOR’S CALCULATION.
Table 4: Call On OPEC Under Three Scenarios (Mn B/D)
| TABLE 4: CALL ON OPEC UNDER THREE SCENARIOS (MN B/D) | ||||
| 2020 | 2025 | 2030 | 2035 | |
| Lower Economic Growth Scenario | 27.3 | 27.4 | 27.5 | 27.6 |
| Reference Case | 30 | 32.3 | 34.8 | 37.5 |
| Higher Economic Growth Scenario | 31.8 | 35.9 | 40.2 | 44.7 |
| SOURCE: OPEC WORLD OIL OUTLOOK, 2013. | ||||